.png)
AI Disclosure Tracker Part I
The AI Disclosures Tracker for Public Software
Software companies have had some time now to rearchitect their product pipelines and positioning given about thirteen quarters since the seminal moment of ChatGPT launch. We examined the top 50 software companies by market capitalization plus a handful of otherwise interesting companies (see methodology at the end of paper) on what they are saying and the specificity of their disclosure of product and revenue. This analysis is drawn exclusively from public filings including prepared remarks during quarterly earnings releases.
With market reaction to software stocks over the last year, 2026 is an important year for companies to start tangibly answering the question: what is AI doing to your business, are you a net beneficiary or should I worry about the terminal value of your business?
As private market investors in the lower middle market at Cover Drive, we are looking for playbooks that show results and learnings that could be relevant for smaller software companies, and what to look for as 2026 and 2027 unfold. We do not look at this through a public market investor lens; our target universe is not companies preparing to go public, and the observations in this paper are written for operators answering to private shareholders, employees, and customers. Our view is that AI is a massive TAM expansion opportunity for software companies, and with the right execution both incumbents and natives can benefit from this just like every prior technology transformation.
This is Part I of a two-part series. Part I covers how the cohort is communicating about AI and what its revenue trajectories have done. Part II turns to what private software operators should take from all of this and some of things to watchout for as we traverse the adoption curve.
How the cohort is communicating about AI
"We are only at the beginning phases of AI diffusion and already Microsoft has built an AI business that is larger than some of our biggest franchises." - Satya Nadella/MSFT
"With Agentforce, we are not just witnessing the future, we are leading it, unleashing a new era of digital labor. We have consumed nearly 20 trillion tokens, and converted them into more than 2.4 billion agentic work units to date, moments where AI was not just reasoning, it was delivering real work." - Marc Benioff/CRM
"ServiceNow also launched Autonomous Workforce, a new class of AI specialists that execute enterprise jobs end-to-end. The first available out-of-the-box is a Level 1 Service Desk AI Specialist that autonomously diagnoses and resolves common IT support requests." - Bill McDermott/NOW
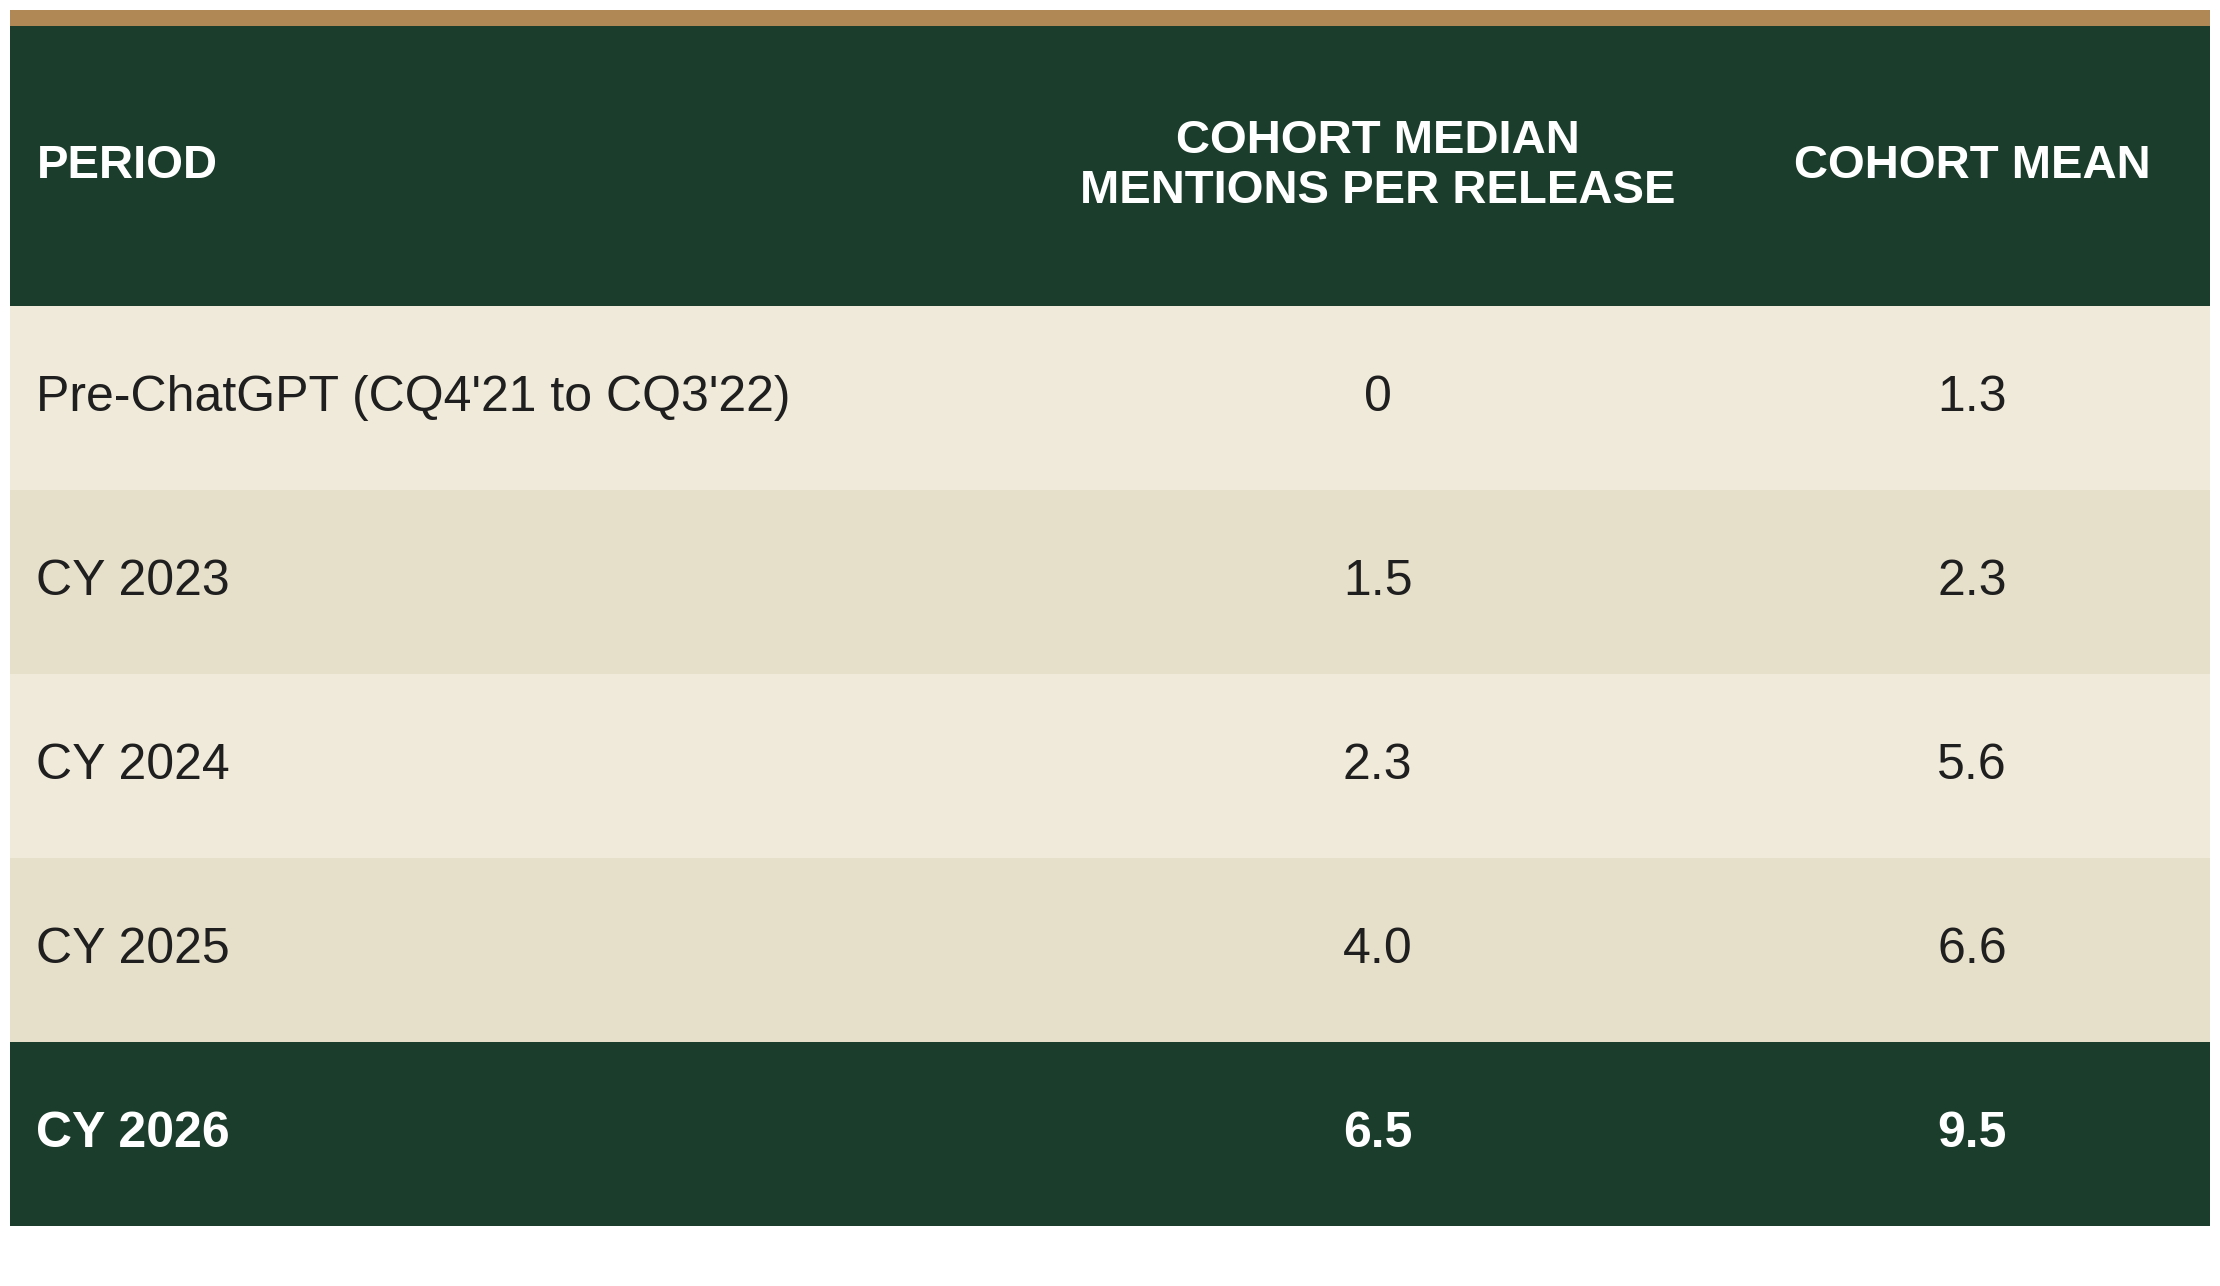
Companies are signaling more attachment to AI
The cohort's mean AI mention frequency in earnings releases is roughly seven times what it was before ChatGPT.
Disclosure is sharply bimodal today
One in five companies has disclosed a hard $ figure for AI revenue. One in five has said nothing about AI in any earnings release across nineteen quarters. The middle 60% provided qualitative or AI-attached commentary.
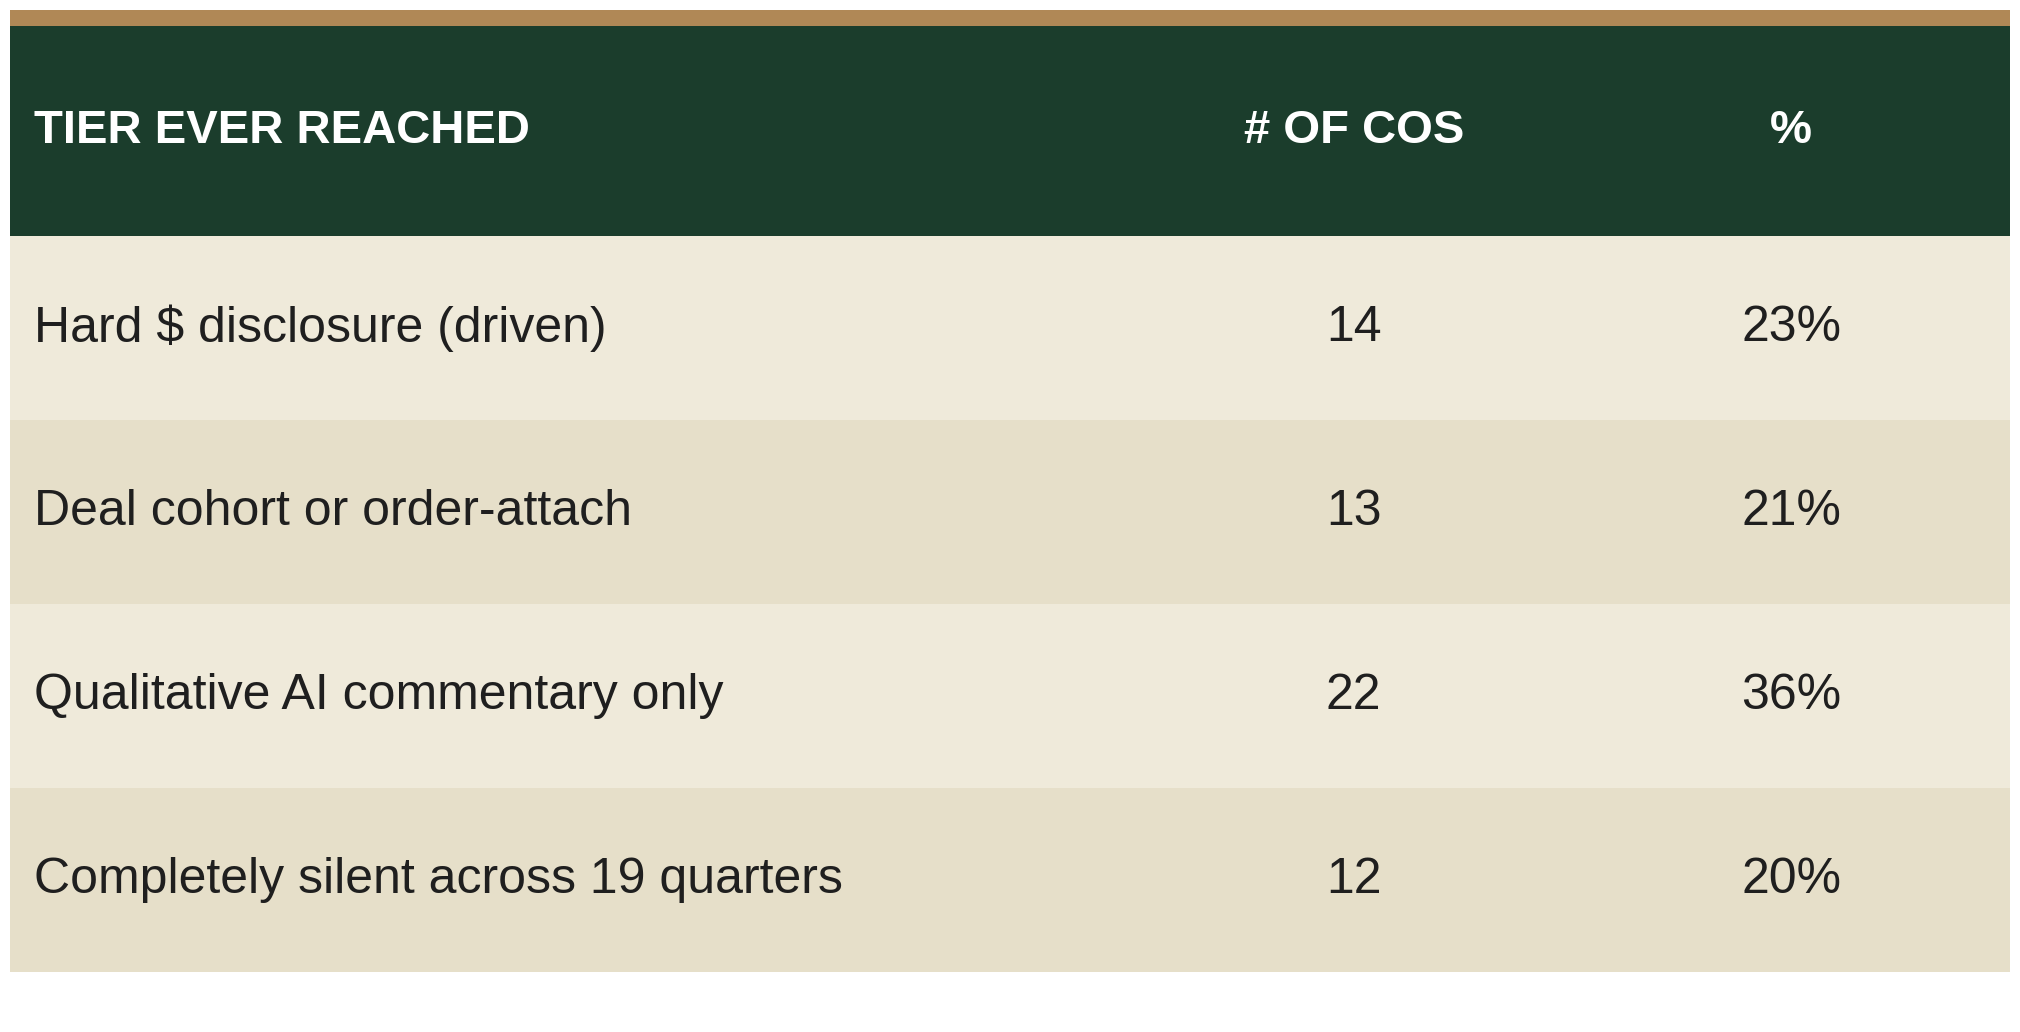
Two qualifications. First, the "driven" tier is partially inflated by data center and AI infrastructure revenue. MSFT, AMZN, ORCL, IBM, and AKAM all disclose AI revenue figures that are largely Azure, AWS, OCI, mainframe, or edge inference compute, which is data center and systems infrastructure rather than application software.
Second, the silent and qualitative tiers reflect three distinct positions. (a) Companies that have made a deliberate choice not to break out AI as a separate segment. (b) Companies that are not yet ready to have shareholders and the sell-side track them on an AI-specific KPI. (c) Companies that do not yet have meaningful AI revenue attribution to disclose. See disclosure step-up below.
Disclosure tier follows a natural category ordering of early beneficiaries
Five categories. Hyperscalers are AWS or Azure-class cloud platforms. Platforms are large horizontal incumbents anchoring multi-product enterprise suites. Infrastructure software sits below the application layer in observability, identity, cyber, data infrastructure, communications, and edge. Horizontal software is horizontal application software, mostly cloud-native. Vertical software is industry-specific application software.
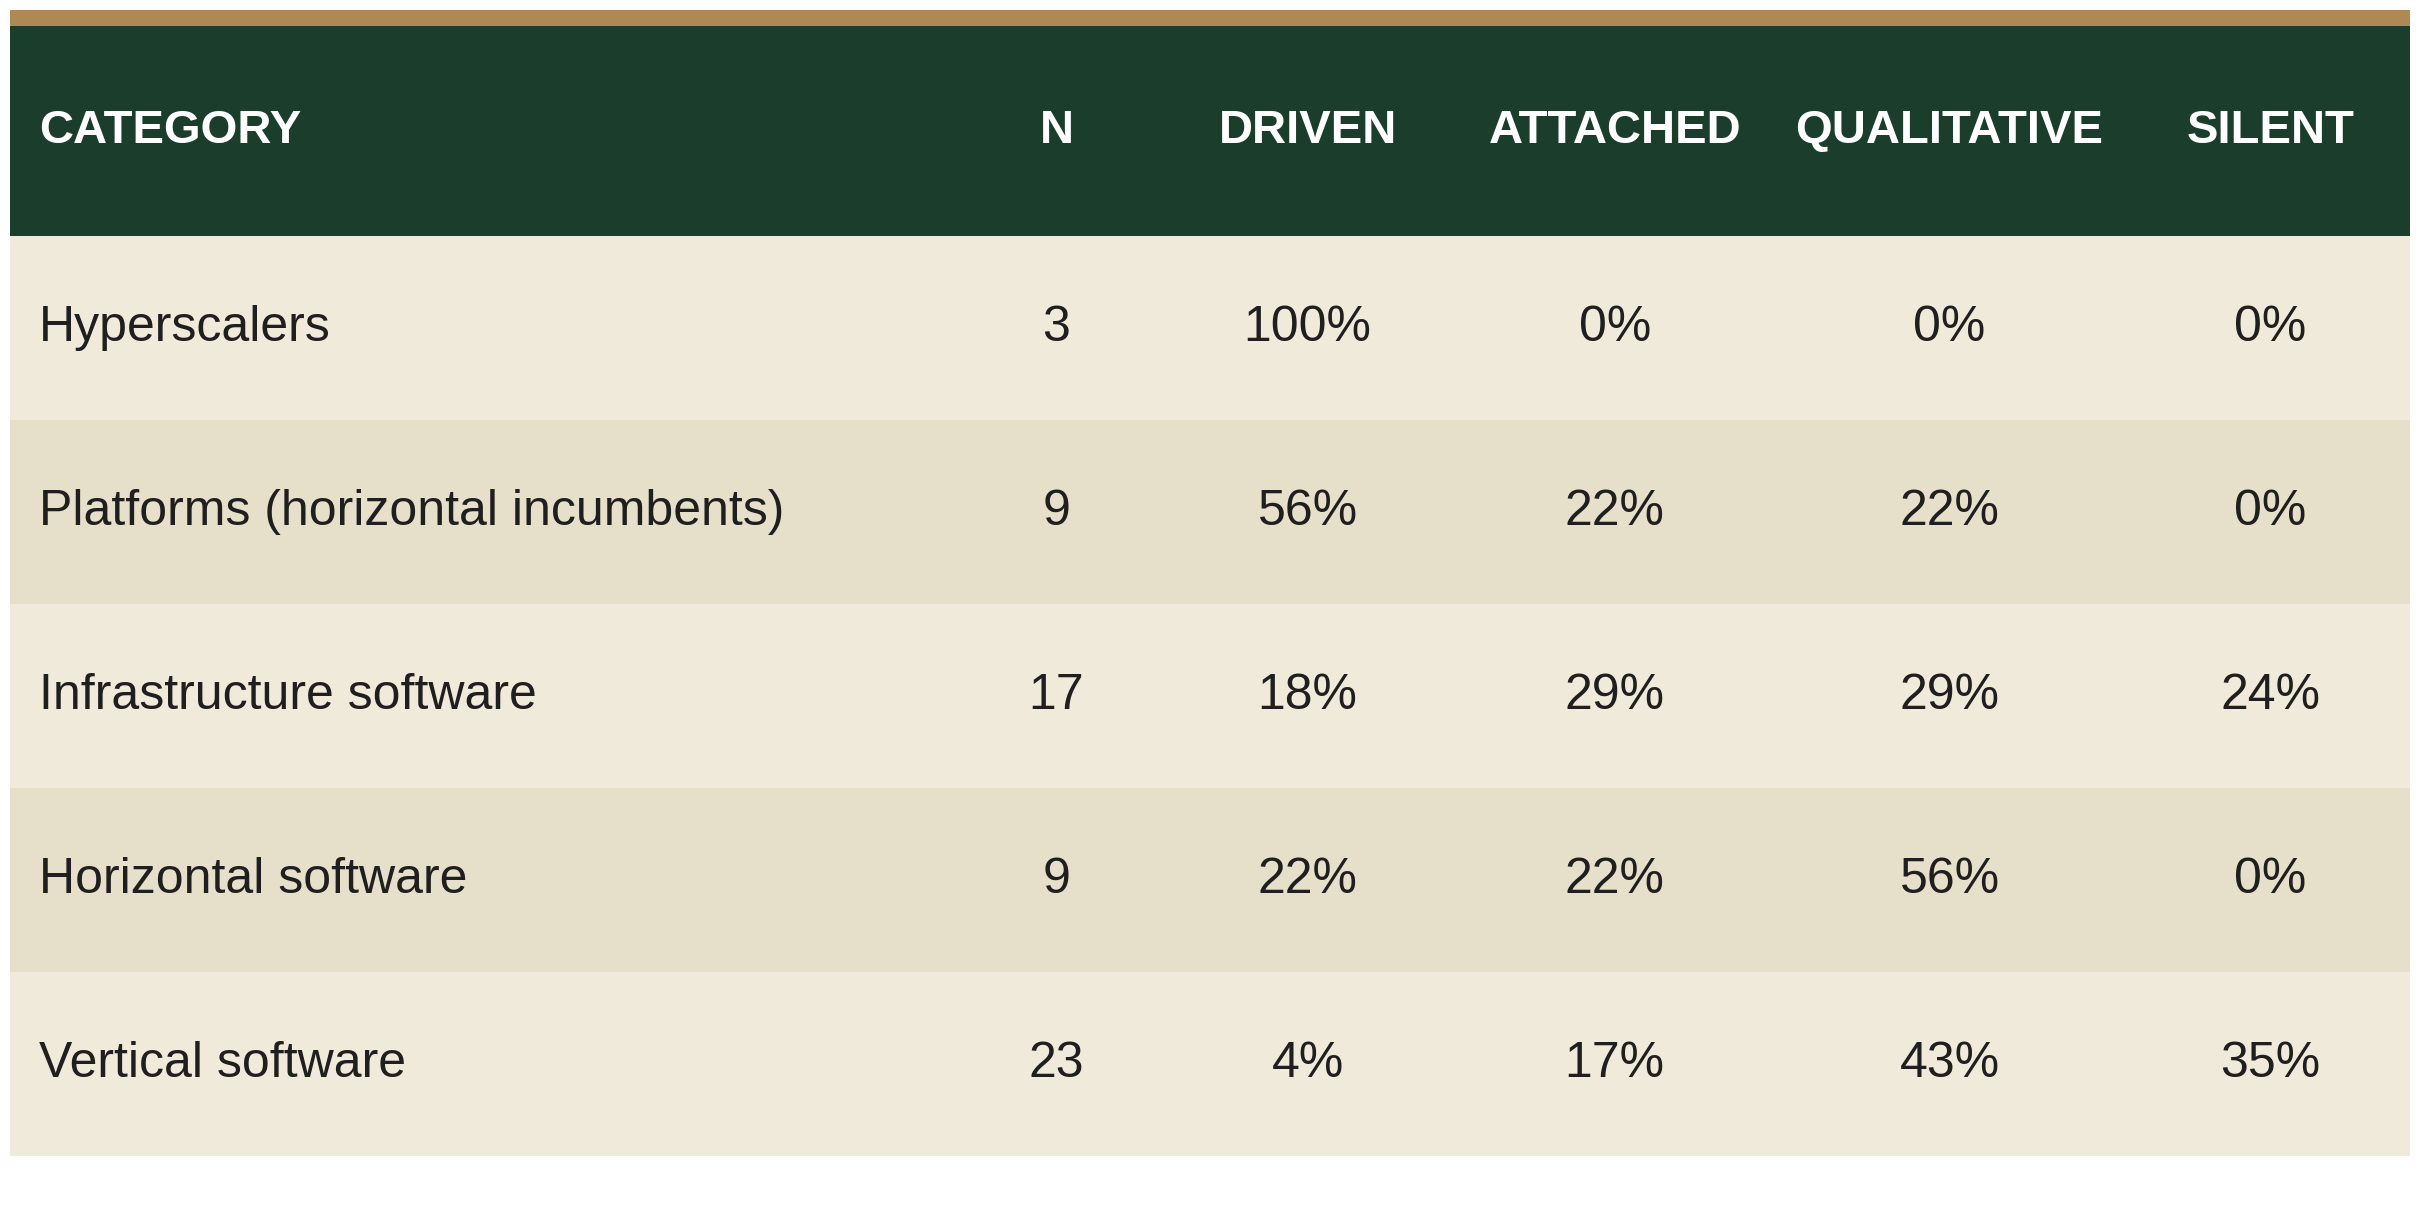
The ordering is what one would expect from where AI value first lands, and, in our view, does not represent the ultimate size of the market opportunity. Hyperscalers monetize AI as a compute and infrastructure layer; their disclosures are unanimous and largest. All the compute runs on them and so no surprise there on being first to revenue. They also incur most of the capex and so the market expects them to be highly precise on the ROI on the spend. Platforms, the multi-product incumbents with deep customer relationships, are next, because AI features attach naturally to their existing suite ARR. Infrastructure software is mixed: cyber and observability are split between disclosure and silence, we see activity picking up here with the new set of security, orchestration, and governance challenges that agents pose. Horizontal software is mostly qualitative so far, they are a mixed bag and will need nuanced look into each business. Vertical software is the furthest back: thirty-five percent of vertical software companies have not put AI in front of investors in any earnings release; only one of twenty-three has put a hard dollar on it.
The vertical position is interesting because vertical software companies tend to own the most proprietary data and the most defensible workflows. The runway for vertical software to translate proprietary data and embedded workflows into AI revenue, in our view, is the largest in the cohort. We are not surprised the category is furthest behind as is natural to the maturity and adoption curve.
The latest quarter marks the biggest disclosure step-up
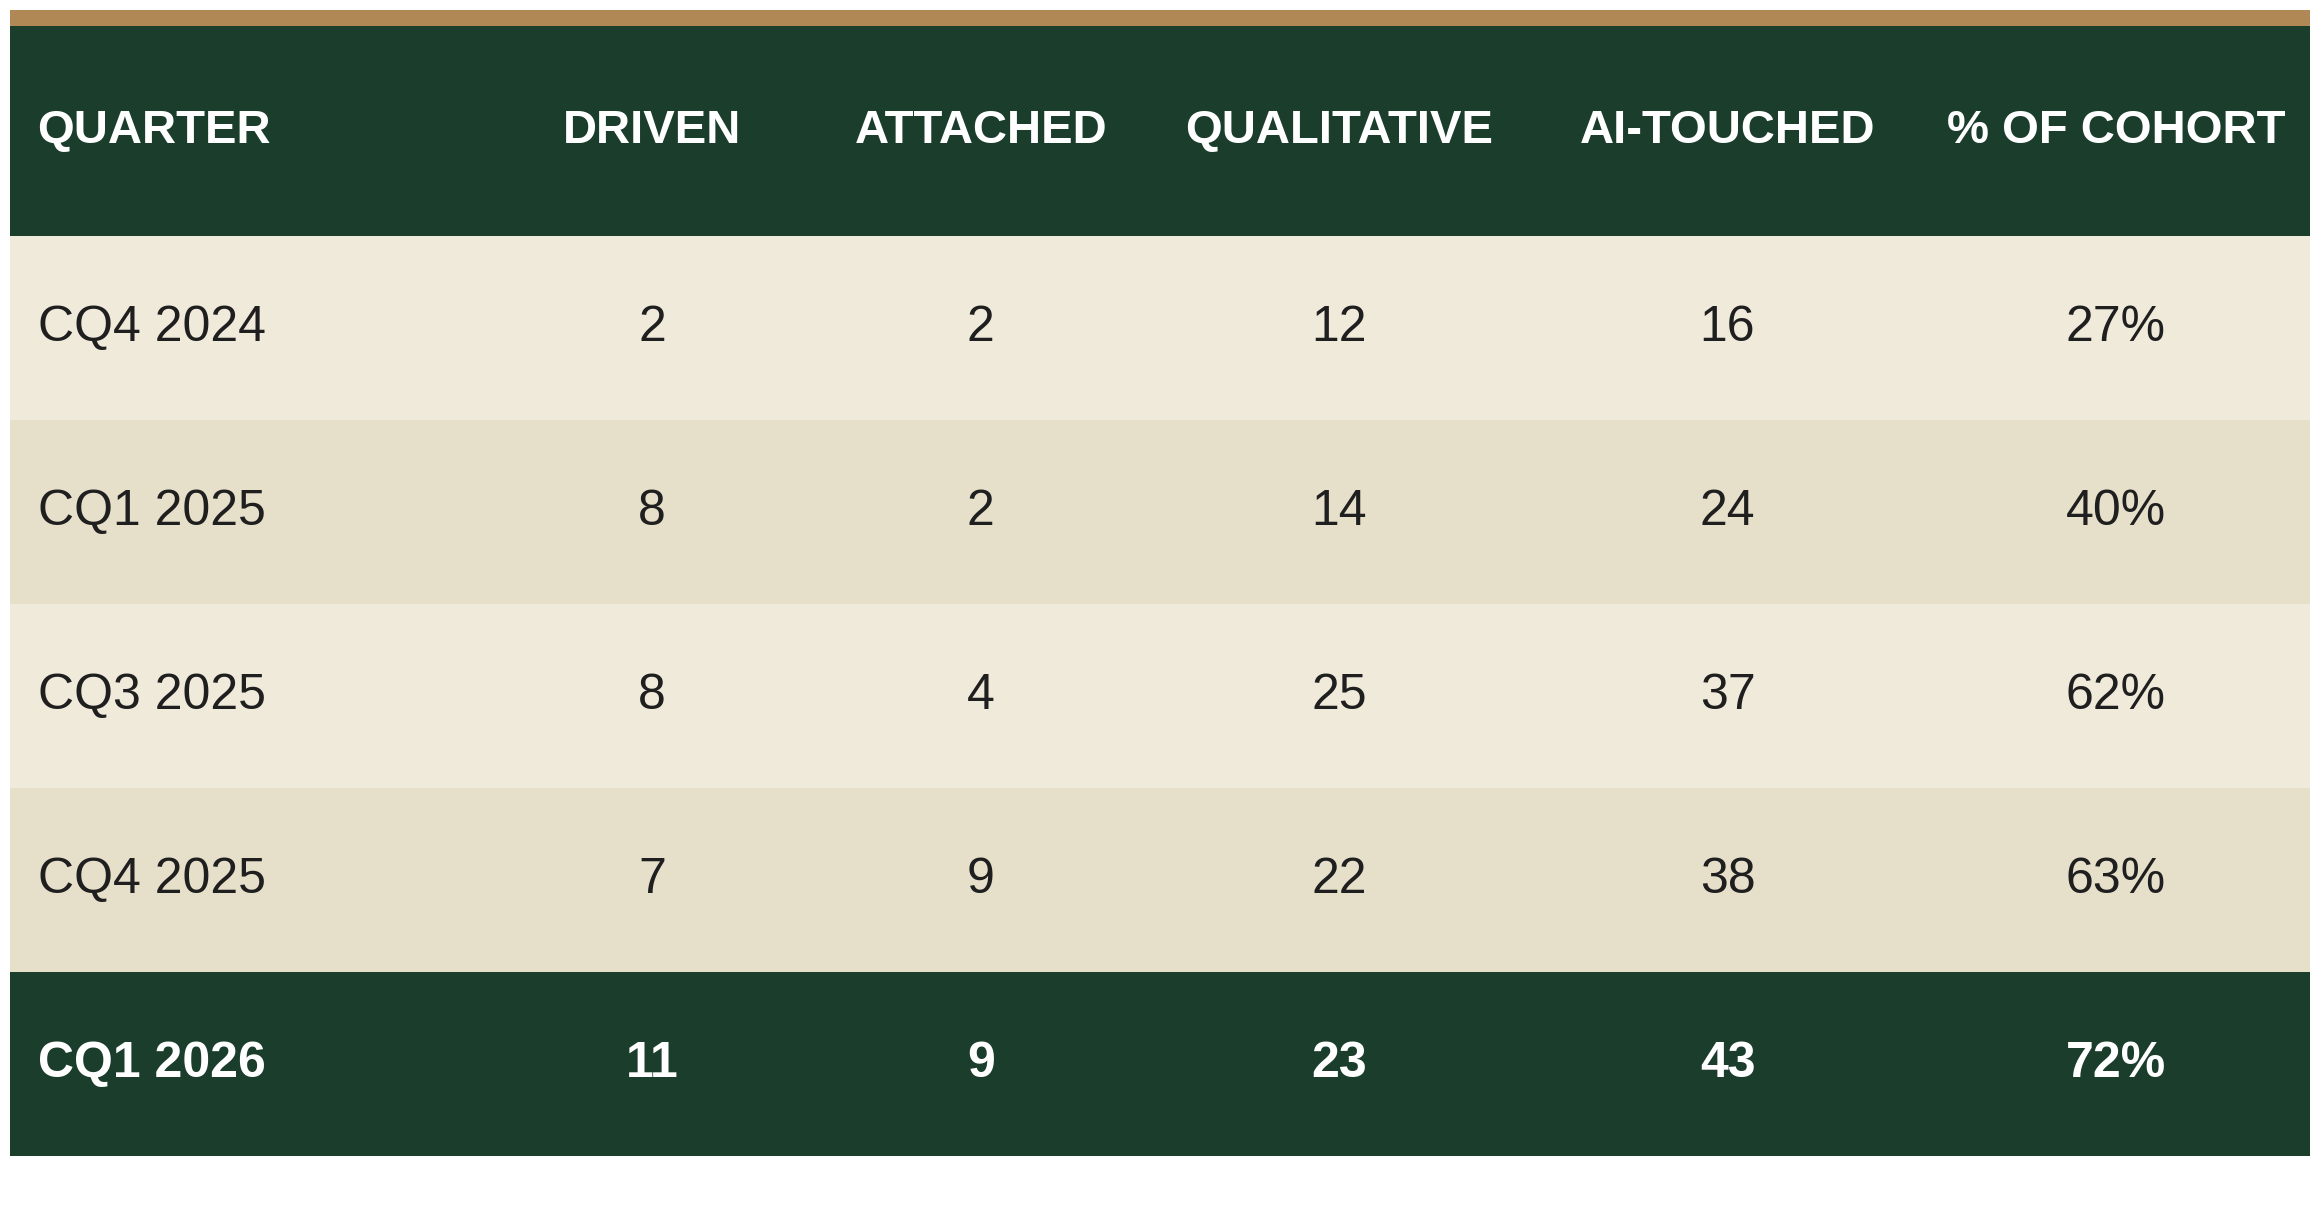
CQ1 2026 was the largest single-quarter step-up the cohort has produced. Adoption-tier disclosure has roughly tripled in twelve months, the biggest movement at any tier.
The cohort has not converged on what "AI revenue" means
There are at least nine distinct framings of "AI revenue" across the cohort, with no convergence. Among the fourteen companies that have put hard dollars on AI, no two use the same primary metric definition.
This matters less for any single company's disclosure than it does for how the market reads the industry. Sell-side analysts, allocators, and customers are all trying to compare AI progress across the cohort. The variation in disclosure framing and the storytelling that surrounds each framing makes that comparison difficult to do consistently. A 10% AI revenue figure under one company's definition is not directly comparable to another company's "AI-Influenced ARR" or "AI cohort attach growth," and the cohort has not produced an industry standard. There must be some convergence in the definitions for the public market to understand the progress and give the industry credit on the opportunity ahead.
In summary, the industry is responding in aggregate. The cohort's AI disclosure is unmistakably moving from silence to commentary to hard dollars. While the pace is uneven, the direction is not. We are now starting to be able to separate the disclosed AI beneficiaries from the laggards within the public set, with the caveat that current disclosure may understate underlying AI economics particularly at the vertical end. For private software companies, the playbook of these large public companies is now visible enough to learn from.
From AI commentary to AI dollars
"Over 75% of Org and Enterprise users who had previously exceeded AI credit limits continued to use AI credits in April and over 95% of those users remained active on the platform. Pro teams that purchased AI credit add-ons had more seats per team and an average ARR of more than three times that of teams that had not purchased add-ons." - Figma/FIG
The cohort sits at very different points along the disclosure path that runs from "we have AI" through "customers are using it" to "here is the AI revenue line." This section moves through the three stages in order: disclosure tier progression, the form AI takes when it ships, the dollars actually disclosed, and whether AI has shown up in cohort revenue growth.
The disclosure path has accelerated, but unevenly across tiers
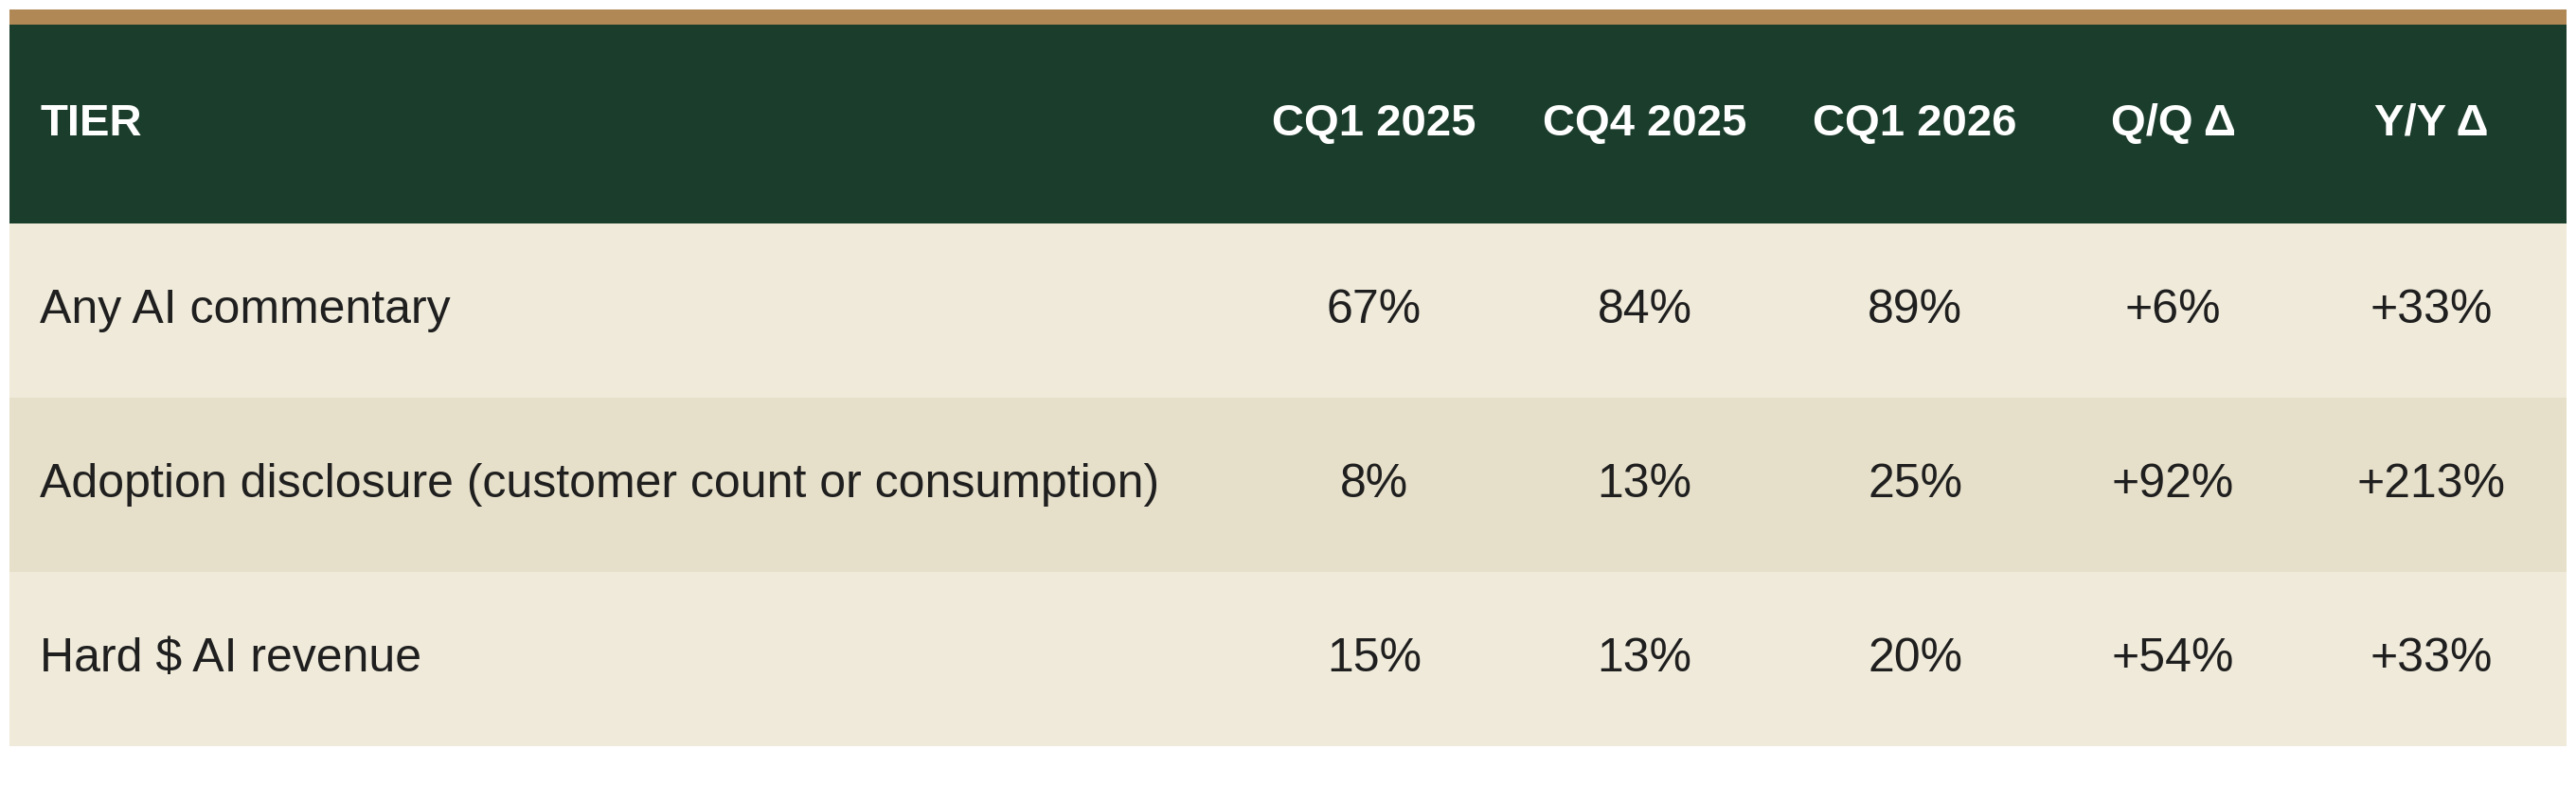
Adoption-tier disclosure has more than tripled in twelve months, the biggest movement at any tier. Hard-$ disclosure is up but slower. The middle of the cohort is moving faster on showing customers and usage than on putting dollars on the page.
Six forms of AI attach are now visible across the cohort
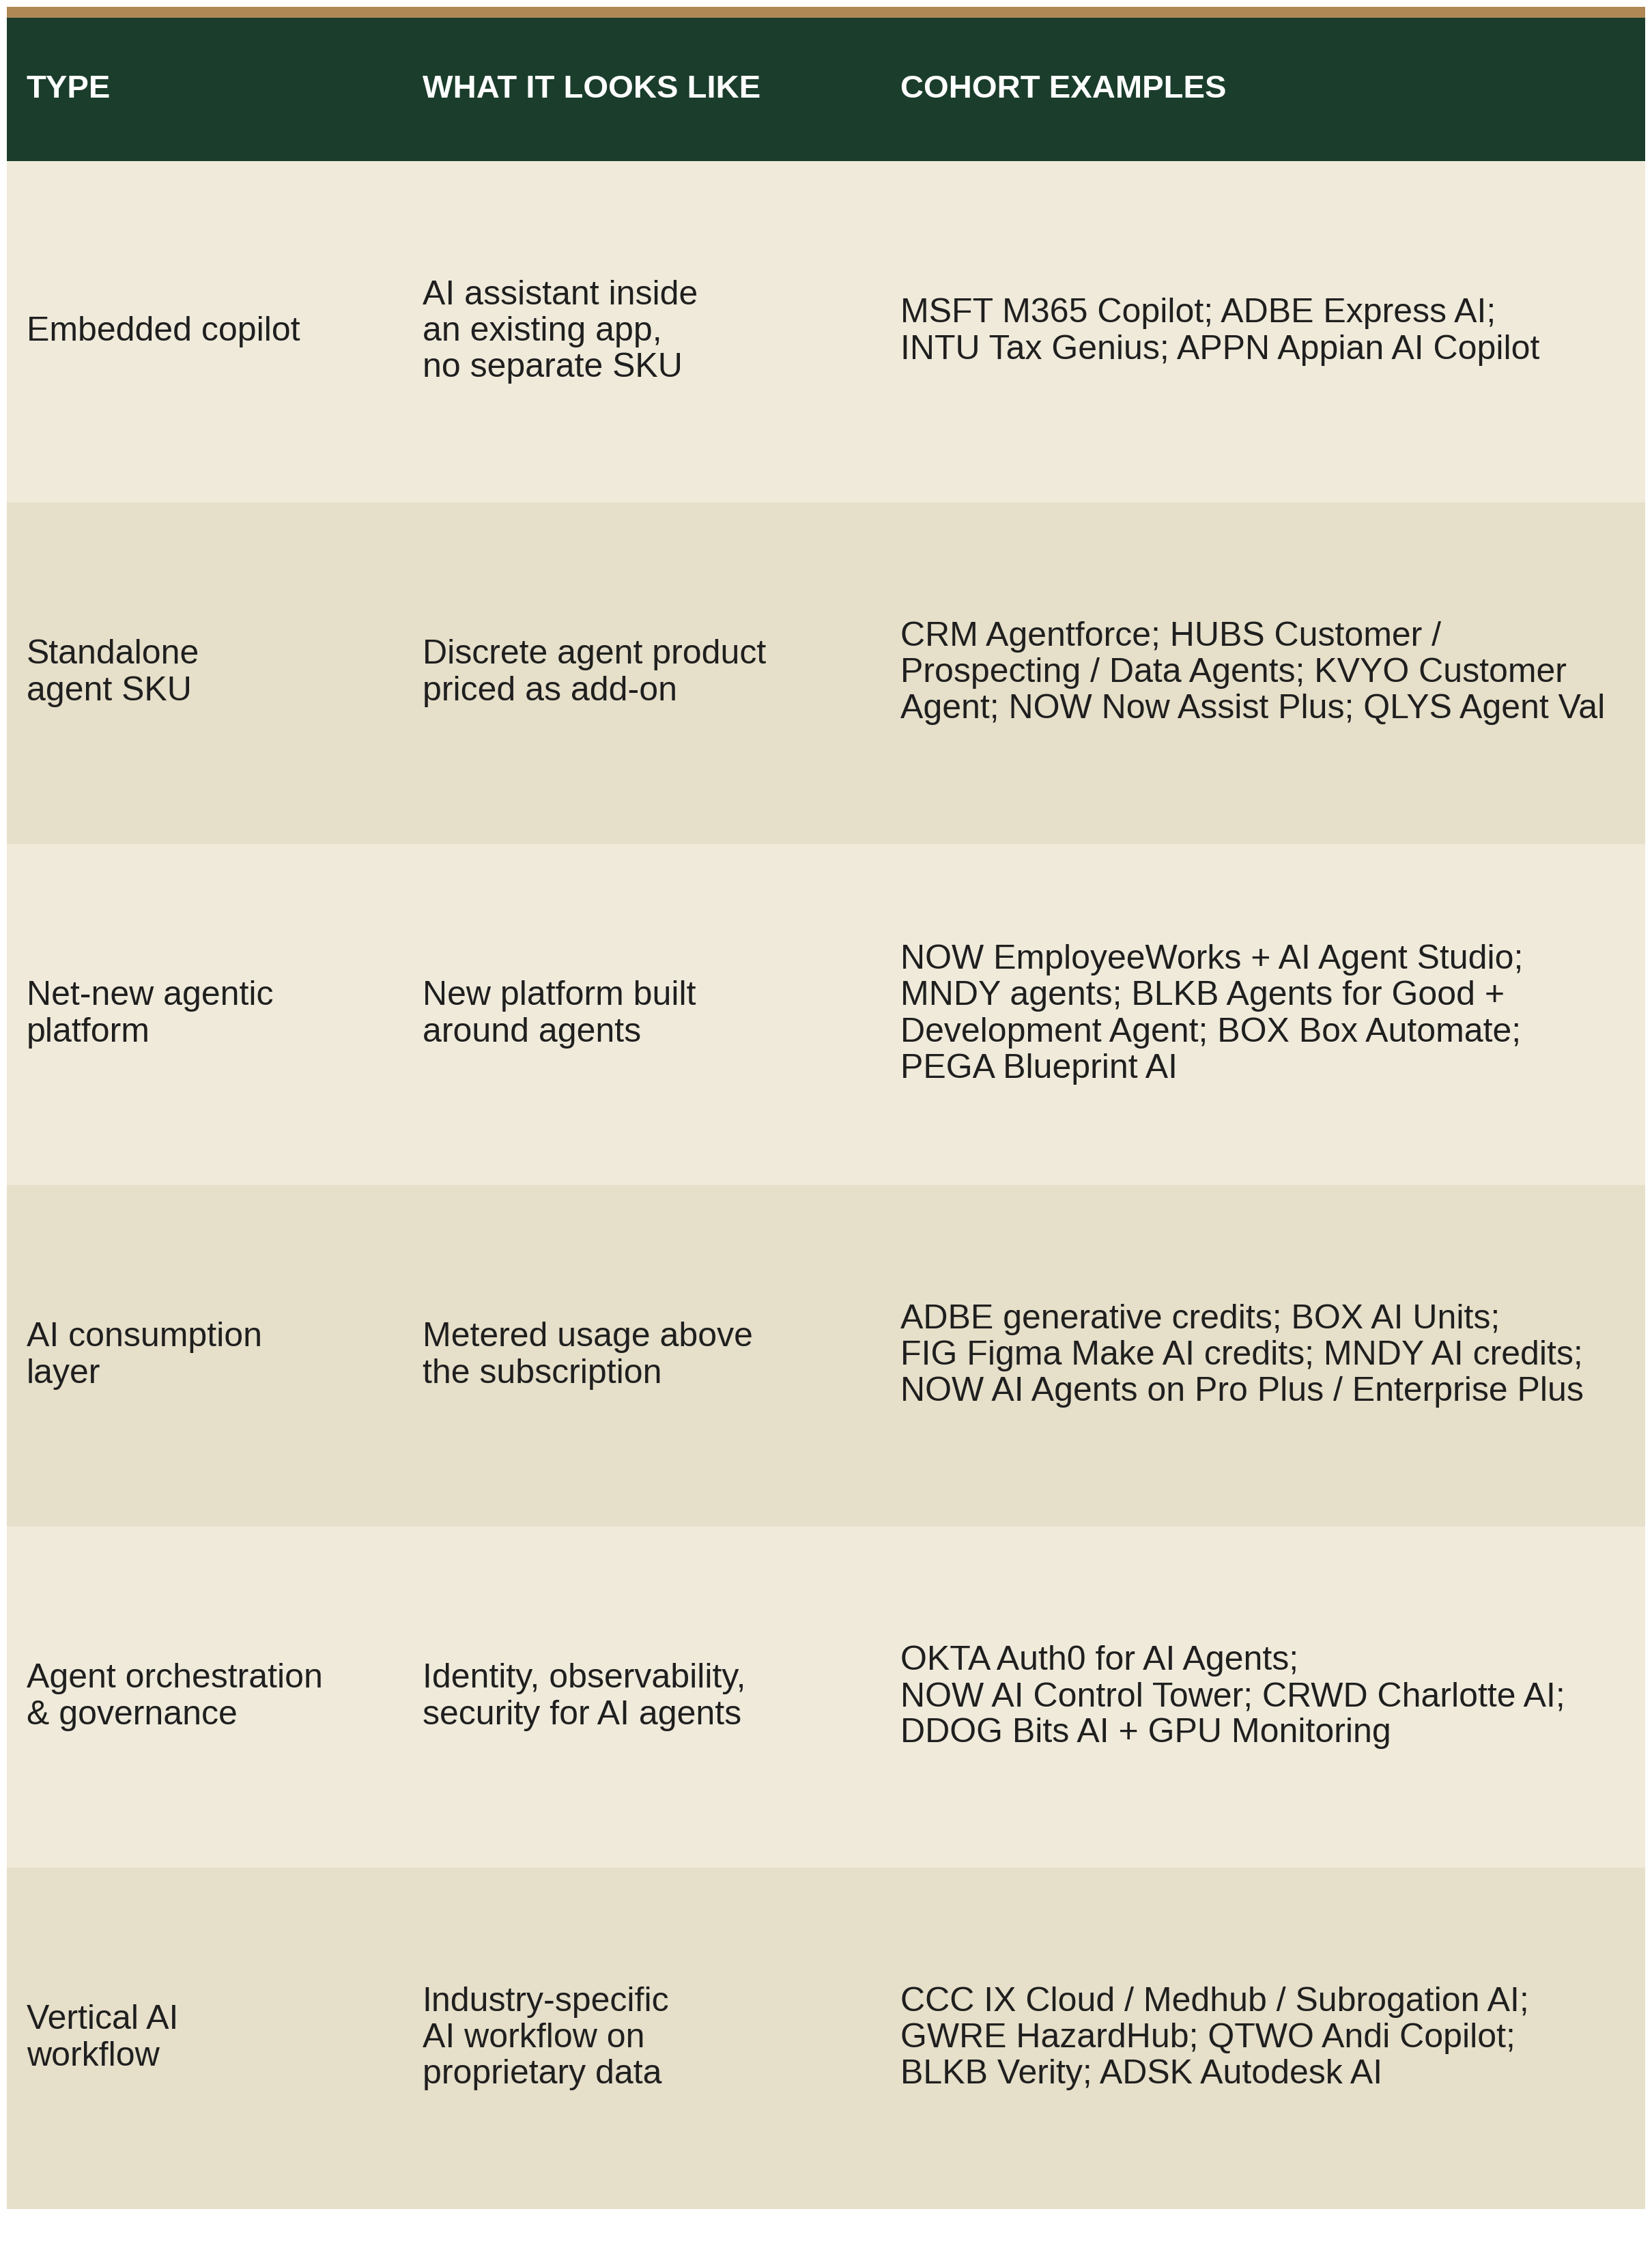
Standalone agent SKUs and net-new agentic platforms are the two most common attach forms. The AI consumption layer, metered usage above subscription, is the emerging fifth form. The cohort is actively experimenting with consumption-based monetization on top of traditional SaaS.
Annual cohort revenue growth: rates back to pre-COVID, dollars at all-time highs
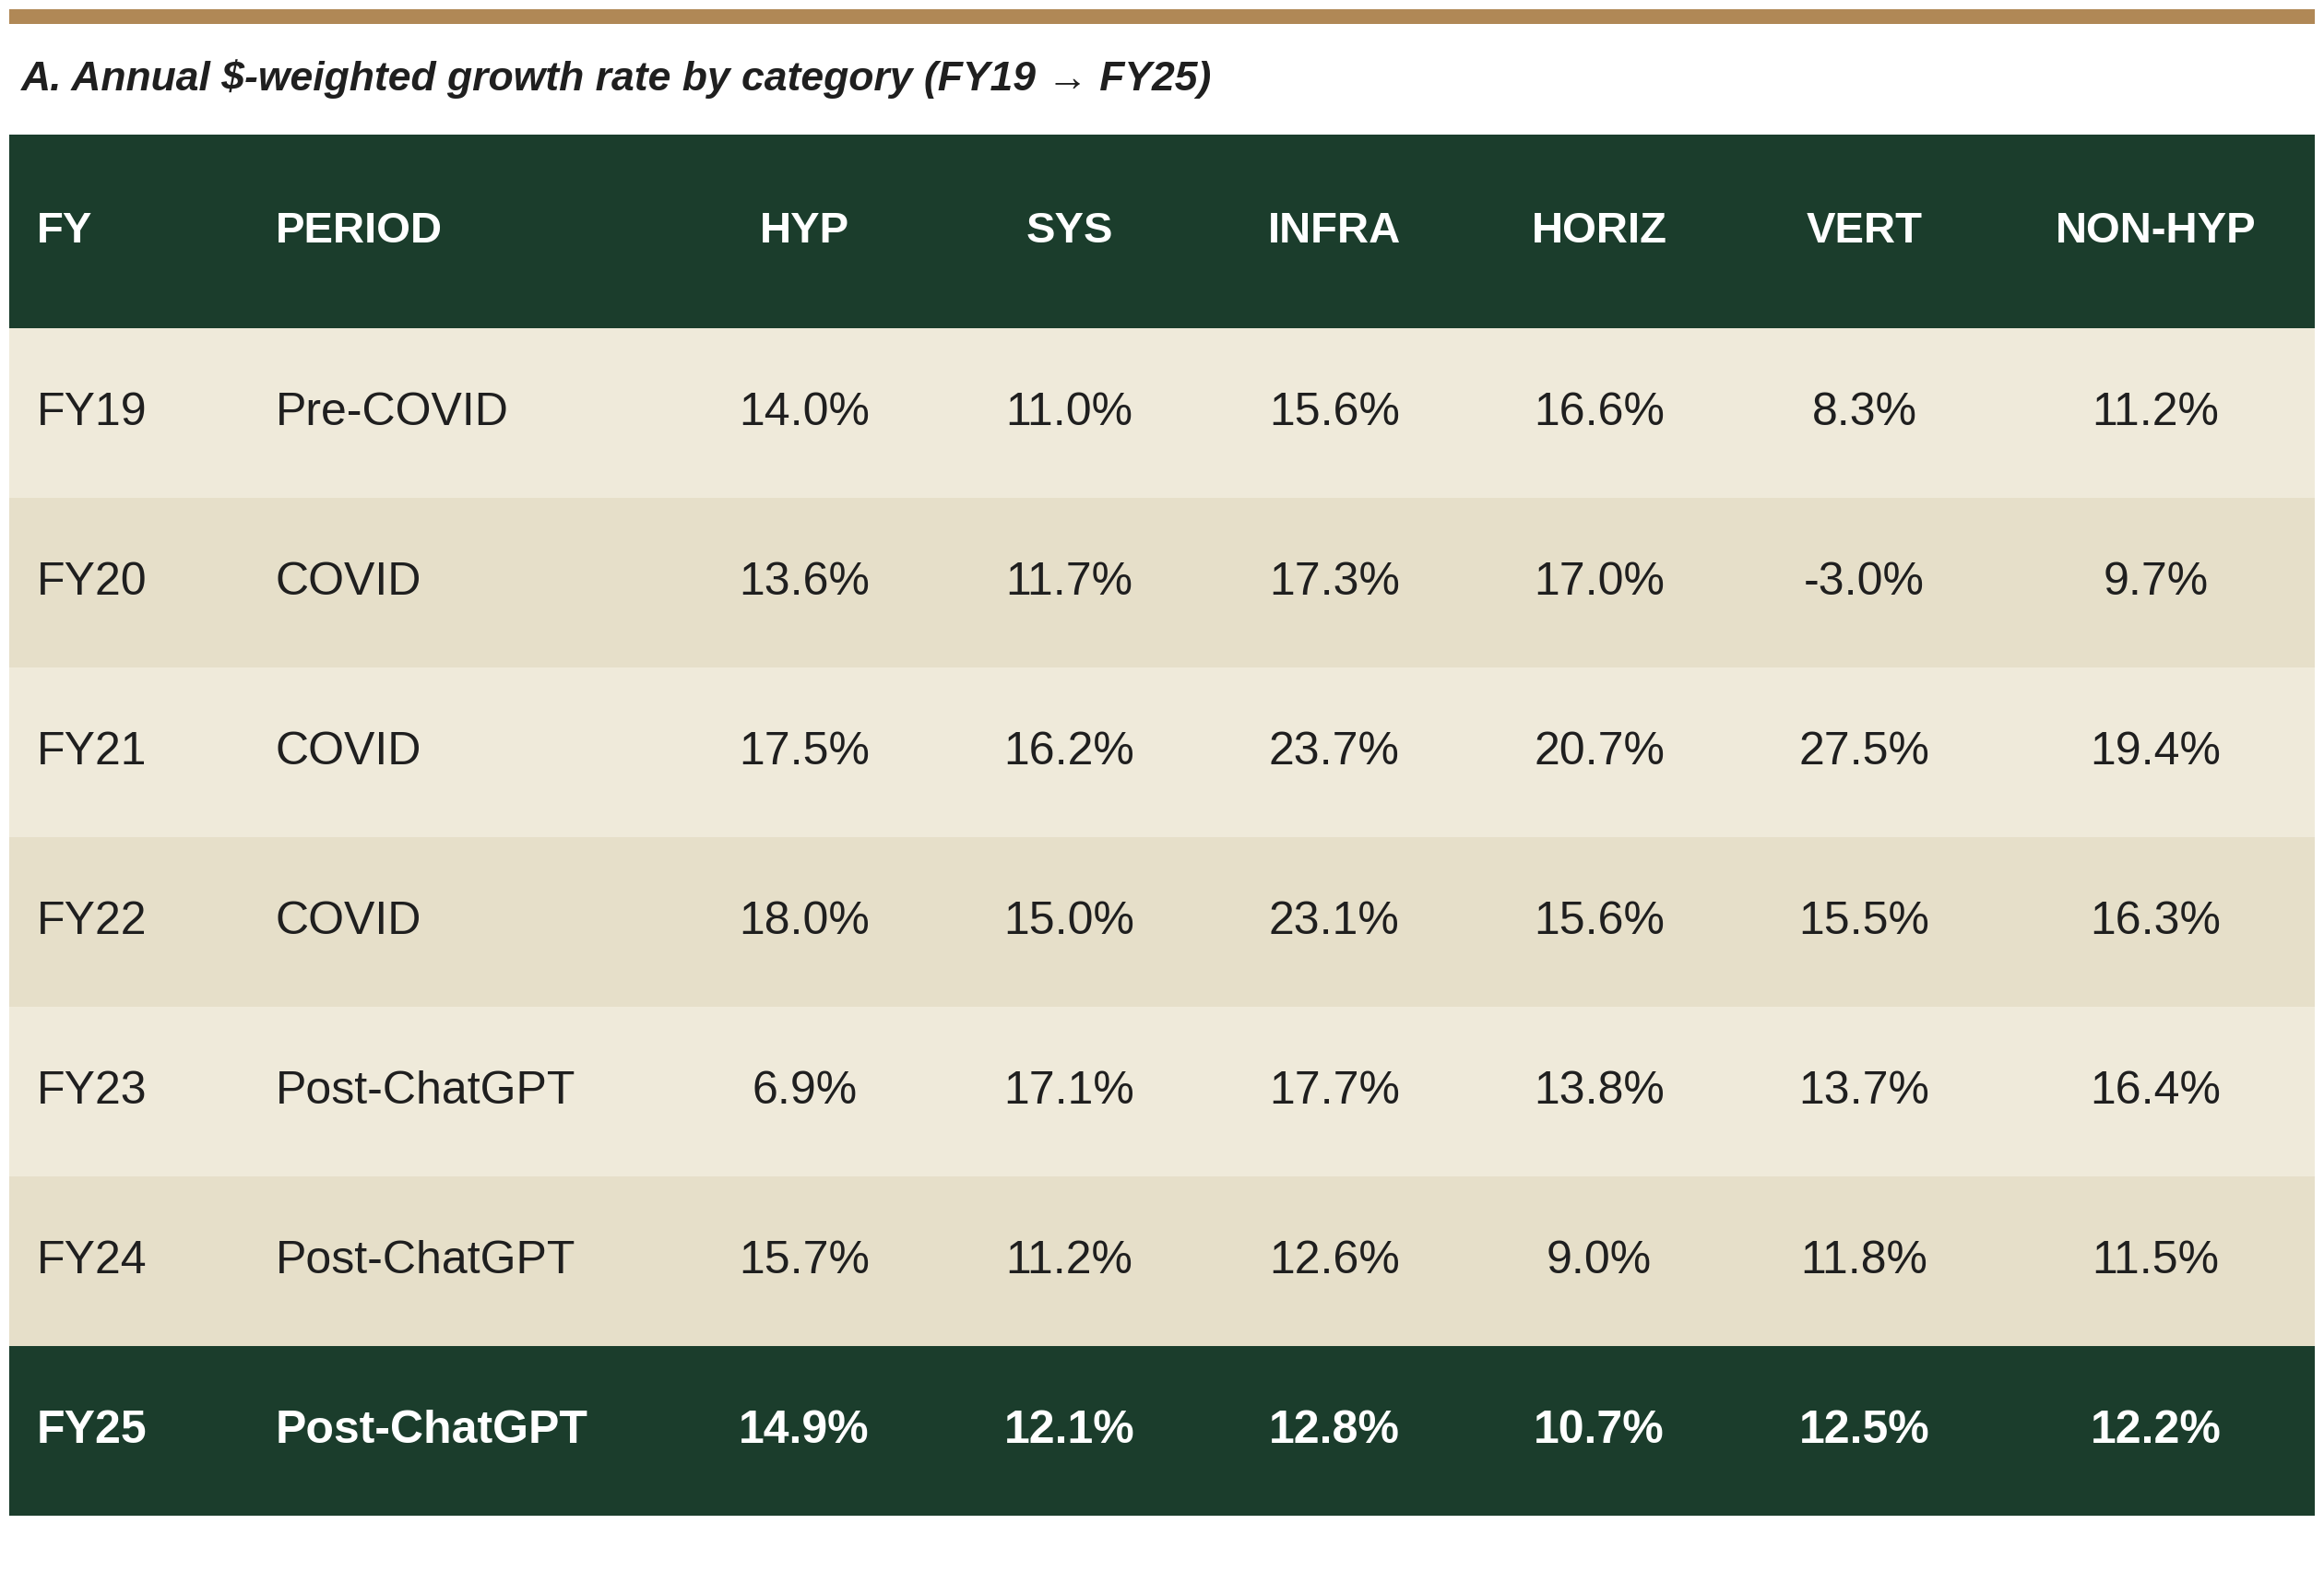
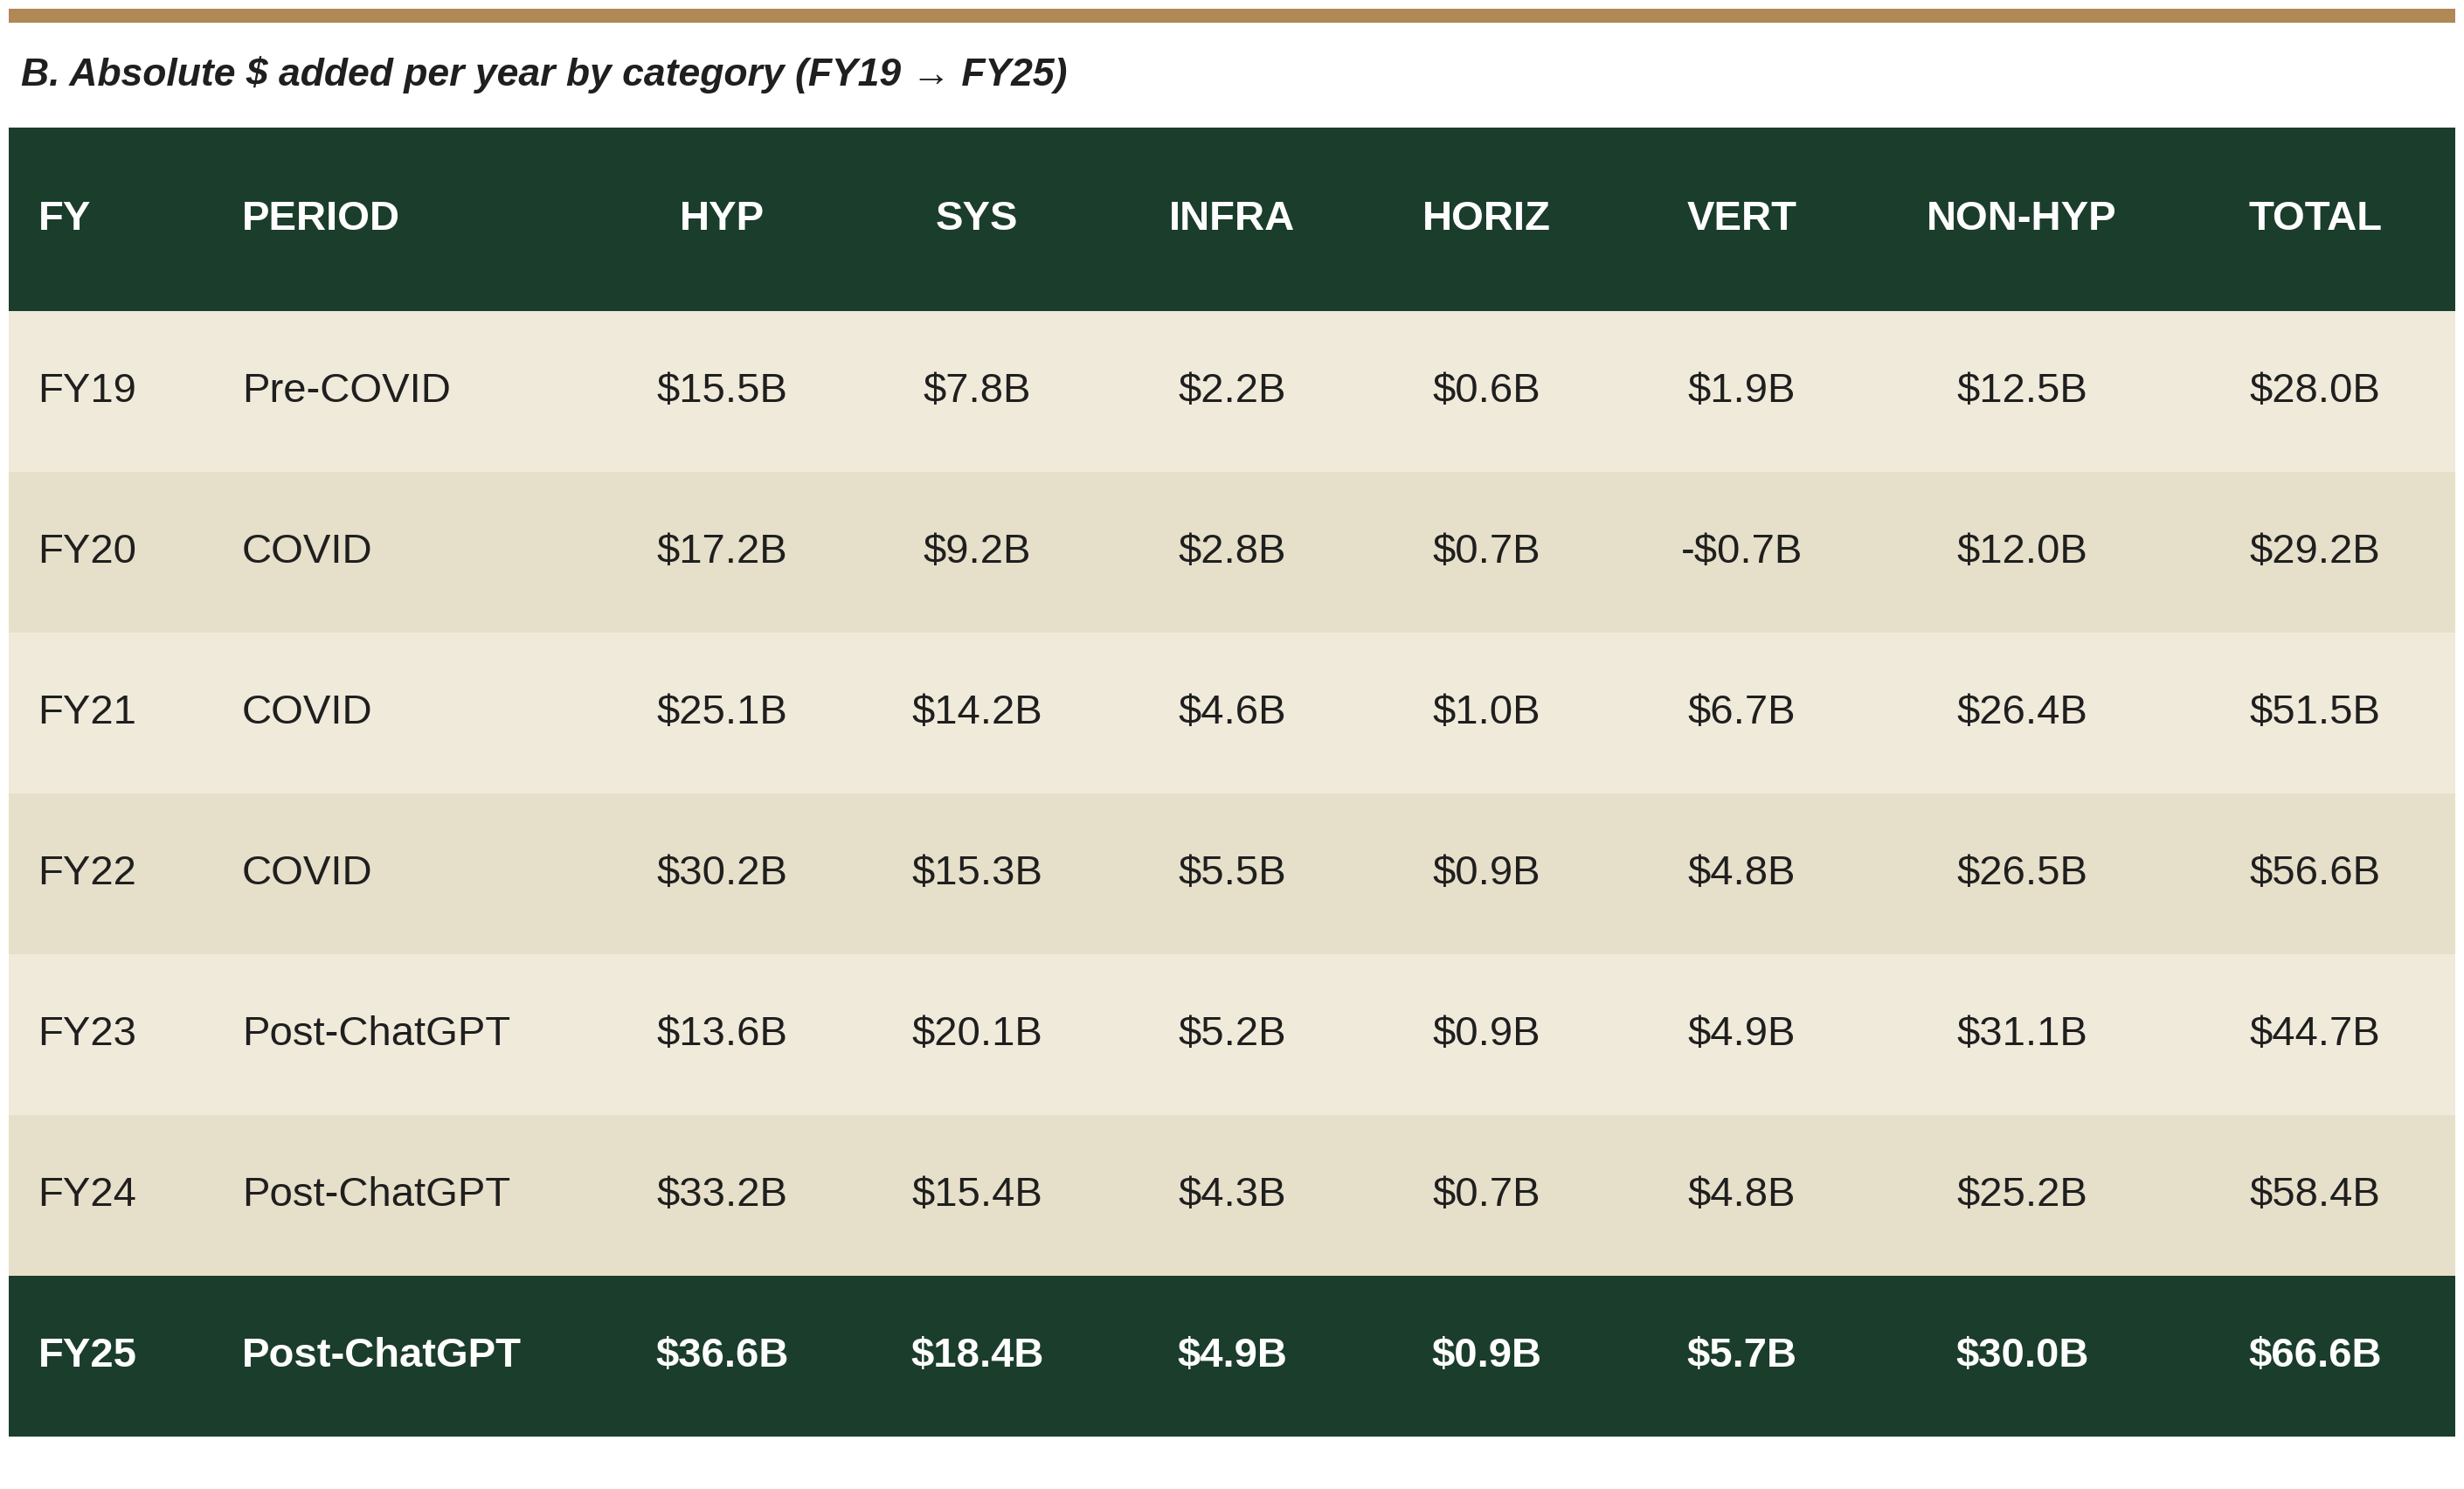
Post-ChatGPT growth rates are, in aggregate, roughly back to pre-COVID baselines after the COVID pull-forward. AI has not lifted growth rates above pre-COVID for most categories.
Hyperscalers troughed in FY23 (cloud digestion) and recovered to 14.9% in FY25, modestly above the pre-COVID 14.0% reading. Horizontal application is the laggard at 10.7% in FY25, well below its pre-COVID 16.6%. Vertical and systems are slightly above pre-COVID. Infrastructure software has decelerated meaningfully from pre-COVID highs.
But that all ignores the base effect. What cannot be missed is that the cohort is adding more dollars per year than ever. Total cohort revenue grew by $66.6B in FY25 versus $28.0B pre-COVID (FY19), which is 2.4x. Non-hyperscaler revenue grew by $30.0B in FY25 versus $12.5B pre-COVID, also 2.4x. Software industry growth in absolute dollar terms is at all-time highs, despite percentage growth being roughly at pre-COVID baselines. Even the FY23 post-COVID trough ($44.7B added cohort-wide) was higher than any pre-COVID year.
The ex-hyperscaler software cohort added $30B of revenue in FY25. The disclosed application AI ARR base of about $3B is roughly 10% of that but largely concentrated in a few companies. This is a metric worth paying close attention to as the N becomes larger.
In Part II
In Part II we examine what the cohort is now saying about AI's impact on its own workforce, including about restructuring engineering and flattening the hiring curve. We then lay out five lessons for private software operators on pricing posture, moat construction, AI as an internal operating leverage source, internal disclosure discipline, and architecting billing for seats and consumption together. We close with what we will be watching across the cohort through 2026 and 2027.
Methodology
All counts in this paper are drawn from documents filed with the SEC: earnings 8-Ks (Item 2.02 with Exhibit 99.1 press release), 10-Qs, 10-Ks, 6-Ks for foreign private issuers, and 20-F annual reports. Sell-side reports are not consulted for this analysis.
Cohort. The 61-company cohort consists of the 50 US-listed software-majority companies analyzed in Cover Drive Insights Article #1 (top 50 by market cap, IPO on or before April 2018), plus 11 companies of specific interest: eight post-2018 IPOs (CRWD, DDOG, MNDY, CCC, ALKT, KVYO, RBRK, FIG), plus AMZN, GOOG, and SAP. Full list: ADBE, ADSK, AKAM, ALKT, ALRM, AMZN, APPF, APPN, BL, BLKB, BOX, CCC, CDNS, CRM, CRWD, CSGS, DBX, DDOG, FICO, FIG, FIVN, FTNT, GOOG, GWRE, HUBS, IBM, INTU, JKHY, KVYO, MANH, MDB, MNDY, MSFT, NOW, NTNX, OKTA, ORCL, PANW, PAYC, PCTY, PEGA, PRGS, PTC, QLYS, QTWO, RBRK, RNG, ROP, SAP, SHOP, SNPS, SPSC, TDC, TEAM, TWLO, TYL, VEEV, VRSN, WDAY, WK, ZS.
Categorization. Five categories using two dimensions: (1) layer in the stack: infrastructure, systems-of-record, or application; and (2) breadth: horizontal or vertical. Hyperscalers (3) own planet-scale cloud infrastructure with capex measured in tens of $B per year. Systems-of-record (9) hold customers' master data and orchestrate enterprise business functions with multi-year multi-million-dollar contracts. Infrastructure software (17) is sold to developers, IT, and security teams. Horizontal application (9) is per-seat productivity software any business adopts. Vertical application (23) targets one industry with proprietary workflows and data. Edge cases (Adobe Document Cloud anchor, Shopify commerce master record, INTU QuickBooks small-business financial systems) are classified by primary segment and customer profile.
Revenue analysis. Non-hyperscaler aggregate excludes MSFT, AMZN, GOOG. Vertical aggregate FY25 includes Synopsys (SNPS) which closed the Ansys acquisition mid-2025; the acquired revenue contributes approximately +0.4pp to vertical aggregate growth in FY25. Excluding SNPS, vertical FY25 growth is 12.1% vs 12.5% reported.
Interested in receiving more insights from Cover Drive Partners?
Subscribe below.